Kamel Ghabte · Data Art · Creative Coding
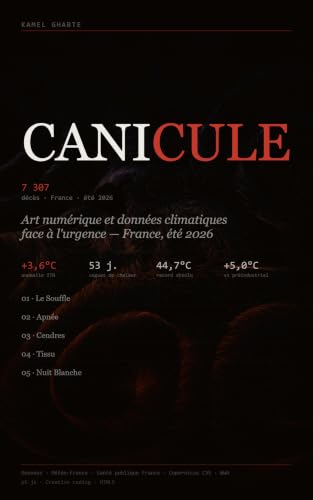
CANICULE
Digital art and climate data
facing the emergency — France, summer 2026
Kamel Ghabte · Data Art · Creative Coding
Digital art and climate data
facing the emergency — France, summer 2026
This book is not documentation. It is an act — an artistic response to a summer that killed 7,307 people in France and 36,210 across Europe.
The summer of 2026 was the deadliest in French climate history since the 2003 heatwave. It broke every temperature record. It burned forests where none had ever burned. It suffocated cities that had never known extreme heat. It killed.
Faced with this reality, one question imposed itself: what can art do? Not inform — journalists do it better. Not convince — scientists do it better. Art can do what neither science nor journalism can: make the body feel what numbers can only state.
This collection presents five interactive digital works created through creative coding with the p5.js library. Each work encodes official, verified climate data into an immersive sensory experience. None is a chart. None shows an axis. All act directly on the viewer's perception.
This book is for scientists seeking unexpected allies, artists seeking a rigorous method, teachers seeking a way to reach their students, and citizens who want to understand — viscerally — what climate data means for their bodies, their cities and their loved ones.
The book is organised in eight parts: a rigorous climate context, the verified data of summer 2026, the artistic and theoretical approach, a genealogy of influences, a detailed presentation of the five works with their full source code, and a critical apparatus of sources.
All meteorological, demographic and environmental data cited in this book come from official sources: Météo-France, Santé publique France, Copernicus Climate Change Service, World Weather Attribution, and Wikipedia (article 2026 European heatwaves, accessed September 2026). Day-by-day simulated data is flagged as such.
Each work is presented with its approach, its data, its technical score and its full source code. The pieces are interactive — they run directly in this book.
Vector field · 55,000 particles · daily heat index as material
The ITN (France's National Heat Index) for each day of summer 2026 drives a Perlin-noise force field. 55,000 particles navigate it. When the temperature is low: a calm fluid, slow blue rivers. When it climbs across the 53 heatwave days: the field accelerates, twists, chaotic turbulence erupts. The viewer never reads a number — they see and feel the shift.
The work advances one day every 2.5 seconds; in 4 minutes it crosses the 92 days of summer. Colour alone encodes temperature: cold ocean blue, temperate amber-gold, incandescent white at the 30°C peak. The motion trail lasts longer when it is hot — heat leaves a trace in space.
Collective lung · 3,000 particles · 7,007 lost
The whole screen is a collective lung. 3,000 particles stand for France's lung tissue (each ≈ 2.3 lost lives). The lung breathes to the rhythm of the ITN: 15 breaths a minute when normal, 30+ when the heatwave strikes — hyperventilation.
At the 30°C peak on 24 June the lung goes into apnea: total black, silence, three endless seconds. Then the cycle resumes, chaotic. The life-particles leave the lung at the real mortality rate: 5,764 in June (~192/day), 1,243 in July (~40/day). At the end: a punctured lung that barely breathes. The black vignette tightens at the edges with the heat — the peripheral pressure of asphyxiation.
500 human figures · Collapse · An ossuary of embers
500 composite human figures (head, torso, arms, legs) stand, breathe, sway slightly — they are alive. Each stands for ~14 lives. Then the heat cuts them down: the body folds slowly along a natural easing curve, the arms drop, the figure sinks into a heap of glowing embers on the ground.
June is the phase of rapid felling (5,764 deaths in 30 days — the pace is breathless). July slows. The heat rising from the embers forms a visible haze as the ground fills. At the end, only the silence and the orange glow on the floor remain.
92 threads · Loom · Thermal vibrations · Burns
92 horizontal threads stretched as on a loom. Each thread is a summer day. Each thread's vibration frequency encodes its ITN — cool days hang slack, heatwave days vibrate at high frequency, snap, twist. The mouse pulls the threads — you feel the resistance of the summer's fabric.
The threads of wildfire days (74 consecutive days of orange risk, 27 red days) are burned: they carry holes, blackened zones, ruptures. June's threads — the heaviest in mortality — take a deeper hue. A ghostly cross-weave reveals the overall pattern: the involuntary textile blueprint of the catastrophe.
The night of 9 July · Vivès, 30.6°C · The suffering body
On 9 July 2026 the weather station of Vivès in the Pyrénées-Orientales recorded a nighttime minimum of 30.6°C — France's absolute record for a tropical night. That night, no one slept normally.
The work IS that night. From 9 pm to 6 am, hour by hour at 8 seconds per hour. Infrared particles rise from the ground (the floor radiates its stored heat). Cool particles try to fall from the sky but are pushed back by the heat. At the centre: the thermal signature of a body in a bed. The body turns over. The heart races — heart rate is directly encoded by temperature (65 bpm at 20°C, 110 bpm at 32°C). The invisible thermometer is a line of colour at the bottom of the screen: its hue IS the temperature.
This page is a preview. The full book — scientific context, verified data of summer 2026, the approach, a genealogy, the five works with their source code, and the critical apparatus — is available in Kindle and paperback.
Kindle edition · $0.99
Also available in French → kamelghabte.me/canicule
CANICULE — Digital art and climate data, France 2026
Concept, creation and text: Kamel Ghabte
Medium: p5.js 1.11.3, HTML5, CSS3, WebGL
Data: Météo-France · Santé publique France · World Weather Attribution · TRACC · Copernicus C3S
Repository: github.com/kamelghabte/canicule-data-art
Typography: EB Garamond (Georg Duffner, 2012) · Space Mono (Colophon Foundry, 2016)
September 2026
This book is a living document. The works embedded in it keep running as long as the browser supports them. The source code is reproduced in full. The data is verifiable. The experience is irreplaceable.